SIL Calcs 101: Venn Diagrams Introduction
Venn Diagrams are the path to enlightenment.
Edited 17March2023: Fixed error in 2oo2 entry on the logic table comments.
Welcome back! Venn diagrams are the path to greatness, at least when it comes to basic SIL calcs—though who knows, maybe also in life.
The reasoning here is straightforward: we’ve already modeled the 1oo1 (one out of one) system in the previous post, now we need to show how to build more complex systems from that simple model.
Venn Diagram Basics
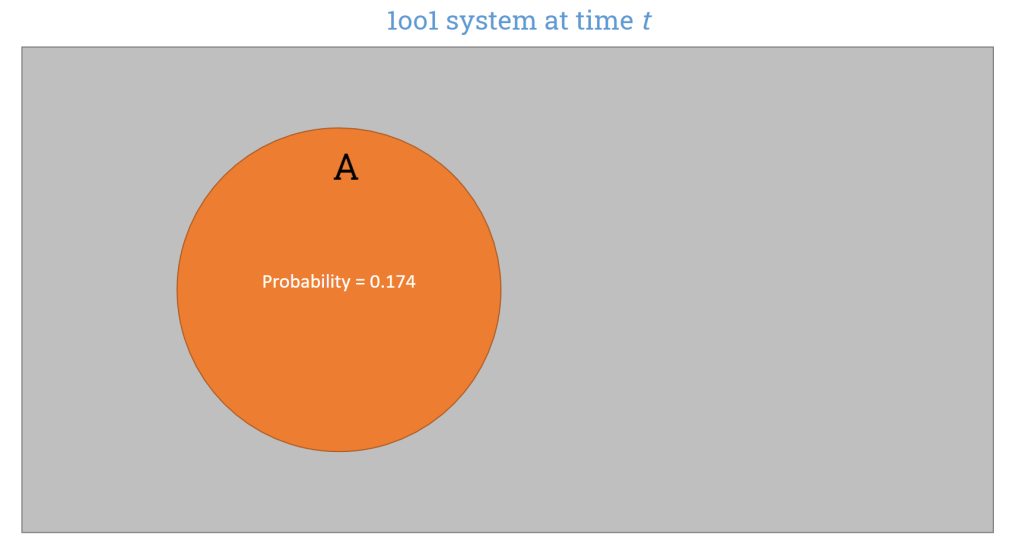
We’ll use Venn diagrams to investigate how events (e.g. failure of level switches) interact with one another. Let’s start with our single element system (1oo1 system):
The entirety of the grey area in the above diagram represents probability 1.0 (100%). The area of the orange circle (event “A”) represents the probability that event A occurs. In this case, event A is the failure of our level switch. So, what this diagram tells us is that, at some time t, the probability that our level switch fails—aka probability of failure on demand (PFD)—is 17.4%.
If you’ve forgotten how to calculate the probability of failure on demand for our level switch (at time t), then please review the introductory post in this series. I’ll summarize here by saying that it comes from our basic equation:
Disjoint Events
Alright, what if we have more than one level switch? First, we need to talk about how multiple events can interact on a Venn Diagram. Let’s assume that we have event A (level switch A fails) and event B (level switch B fails). One possible representation is shown below:

The important feature of this diagram is that the events do not overlap. This is termed “disjoint”, and it means that it is impossible for the two events to occur simultaneously.
With a few minutes thought, you’ll notice that this isn’t a good model for our two level switch system. I could always walk out to the field and smash both level switches with a sledge hammer, which would result in both of them being failed at the same time. So what is this model good for? Mutually exclusive events like rolling a die—if I roll a six, then I haven’t rolled a five.
Nevertheless, consideration of disjoint events can occasionally be useful to help us understand our systems.
Independent Events
Disjoint events weren’t the way to go, so what is next? Generally speaking, if disjoint events are those with no overlap, then the remaining types of events must be those that overlap. Overlapping events are typically broken up into two categories, independent events and dependent events. We’ll first deal with independent events.
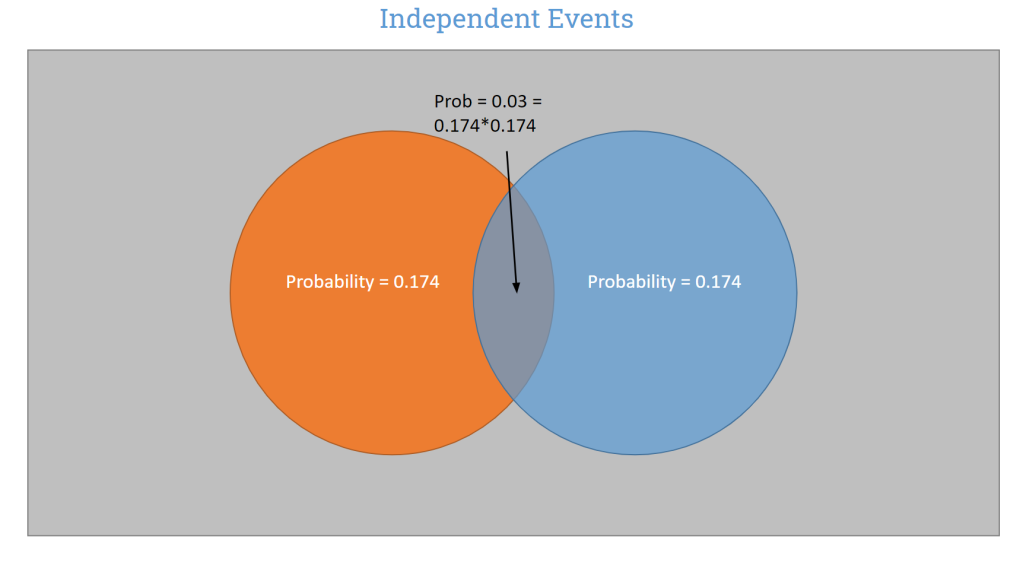
The important features here are:
- The events are overlapping (i.e they can happen together)
- The probability that they occur together is exactly equal to the product of each individual event’s probability
Let’s call the probability that event A occurs (level switch A fails) as PA and the probability that level switch B fails as PB
Then, the probability that both level switches fail together (which is the area of the intersection on the diagram), is:
This is the probability that both level switches fail at the same time, due solely to random chance. Said another way, this represents the probability that level switch A fails, and then— just by random chance—B happens to fail too. There is no dependency (or common cause failure) involved in this.
Independent events are a slightly better model of our two level switch system. At least we allow for the possibility that both switches are failed together, even if it is only by random occurrence. Realistically, we would expect some dependency between the two level switches, i.e we expect there is some chance that they both fail for the same reason. This brings us right along to our next topic.
Dependent Events
Dependent events represent things that happen together either:
- More frequently than random chance alone would suggest (positive dependency)
- Less frequently than random chance alone would suggest (negative dependency)
In practice, negative dependencies are rare in an operating plant (I have two level switches, attached to the same vessel, exposed to the same process conditions, and for some reason they are both less likely to fail). Consequently, we are going to confine our discussion to positive dependencies.
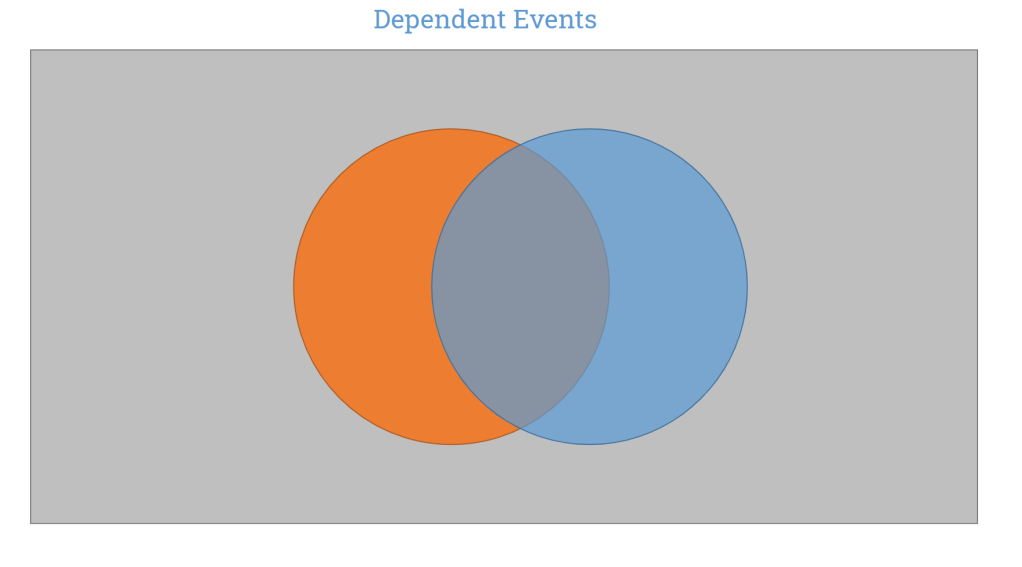
Assume the events pictured above are positively dependent events. You can clearly see that the circles overlap more than in our independent case. This is telling us that there is a greater—as compared to random chance—probability that these two level switches will fail together.
The question here is, how do we find the area of the intersection? There is no simple rule for it, like there was for independent events. This is a topic worthy of it’s own post, so for now, let’s just rest things here.
Event Hierarchy
An outline of the topics covered above may prove useful. Presented below are the types of possible events we might model on our Venn Diagrams.
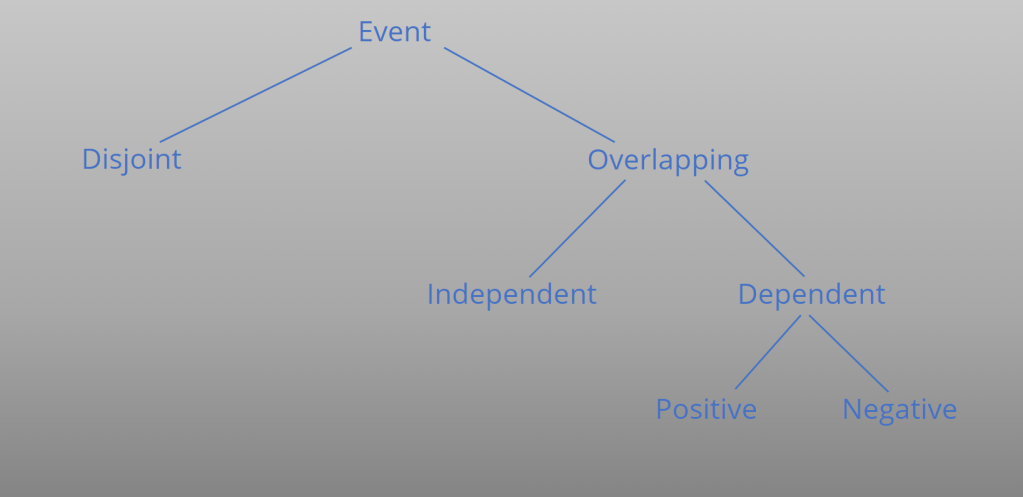
As you can see, disjoint events can’t be independent, and independent events are certainly not disjoint (or dependent!).
Venn Diagrams and Safety Systems
So how does all of this probabilistic nonsense actually get applied to our safety systems? Well, lets consider a simple setup with two level switches. What would happen if the failures of these switches were disjoint events?
Disjoint Level Switches
First thing is first, if I have a safety system, I want to know how it’s voting. Consider the one out of two (1oo2) disjoint arrangement of these level switches. Think through what this means: if the switches vote 1oo2, then both level switches need to fail for the safety instrumented function (SIF) to fail (because if any single switch votes to trip, then the SIF trips). So we are looking for the probability that both level switches are failed simultaneously. See diagram below for a refresher.
Recall from our above discussion (or by looking at the above diagram) that it is physically impossible for disjoint events to occur simultaneously. This implies that the probability of failure on demand (PFD) for our 1oo2 SIF is zero, i.e it is impossible for this SIF to ever fail. Clearly this is not a realistic situation, but its a starting point.
Let’s check out the 2oo2 disjoint system next. Think through the 2oo2 arrangement of the level switches. Both switches have to vote to trip for the SIF to trip. That means that if any one switch fails, then the SIF is failed (since it’s not possible for both votes to ever ring in). The probability of failure on demand for our SIF then is the probability that either the first switch fails, or the second switch fails. A little staring at the above Venn Diagram should convince you that this works out to PA + PB.
Independent Level Switches
Next, consider a system of independent level switches. Remember that this implies that the switches can fail together, but only by random chance. Vote the system 1oo2: again this means that if either switch votes to trip, then the SIF trips. Consequently, both level switches need to fail for the SIF to stop functioning. So, we are looking for the probability that both level switches fail together. This equates to finding the area of the intersection in the below Venn Diagram (because the intersection represents the overlap—i.e when they happen together— of the events). Because the switch failures are assumed to be independent events, we know that the area of the intersection is equal to the product of the probabilities of each event: PA*PB
The 2oo2 case is slightly more complicated, though not by much. Let’s think through it. If the switches are voting 2oo2, then both level switches need to trip for the safety function to trip. This means that if either level switch fails, then the safety function no longer works. We want to know what the chances are that either switch A fails, or that switch B fails. However, in this case we have an area of overlap in the Venn diagram, so if we simply said that the probability was PA + PB —as in the disjoint case—we would be counting the intersection twice! Please convince yourself that this is the case based on the above diagram.
The correct formula here is that the total area covered by the union of these independent events—and thus the probability of failure on demand, since area represents PFD for us—is: PA + PB - PA * PB. You will notice that we subtract out the area of the intersection one time, this is to prevent us from counting it twice.
It is very important to note here that, for the 2oo2 case, the PFD of the independent events is less than for the disjoint events. Let me put the diagrams up one after another so you can see it visually:
Clearly the total area occupied in the independent case is less. This should be striking to us, when we allow our two level switches to fail simultaneously, it’s less likely that a 2oo2 SIF fails! Making sense of such a thing will be the topic of a future post on dependency and Beta Factor models. For now, just keep it in mind as a curiosity.
More than two Events
This idea, of finding the area (technically counting the elements) of the unions and intersections of events can be generalized via the inclusion-exclusion principle. I’ve included some common ones in the table below. Remember, we can’t actually compute these unless we know how to find the area of the intersections—which, so far, we only know how to do for independent events. For this reason, the table below assumes independent events.
| Voting | Formula | Comment |
|---|---|---|
| 1oo1 | PA | Single element system |
| 1oo2 | PAPB | Both must fail |
| 2oo2 | PA + PB – PAPB | Either device fails |
| 1oo3 | PAPBPC | All devices must fail |
| 2oo3 | PAPB + PAPC + PBPC – 2PAPBPC | Any two devices must fail |
| 3oo3 | PA + PB + PC – PAPB – PAPC – PBPC + PAPBPC | Any device fails |
That’s it for Venn Diagrams, at least for now. In the next post we will cover modeling multiple element systems.