SIL Calcs 101: Multiple Elements
Sil Calcs on systems with more than one device.
Edited 17March2023: Fixed 2oo2 comment in table to say that either device fails
Let’s make a multiple element system, I can’t think of a better way to spend time. We’ve previously modeled a single level switch, now we will model two level switches!
Recall our table of formulas from the Venn Diagram post:
| Voting | Formula | Comment |
|---|---|---|
| 1oo1 | PA | Single element system |
| 1oo2 | PAPB | Both devices fail |
| 2oo2 | PA + PB – PAPB | Either device fails |
| 1oo3 | PAPBPC | All devices must fail |
| 2oo3 | PAPB + PAPC + PBPC – 2PAPBPC | Any two devices must fail |
| 3oo3 | PA + PB + PC – PAPB – PAPC – PBPC + PAPBPC | Any device fails |
1oo2 Independent Level Switches Permalink
Again, lets think through what we need to calculate. A 1oo2 voting arrangement of level switches means that if either level switch trips, then the safety instrumented function trips. This implies that both level switches need to fail for the SIF to fail. Therefore, we need to know what the chances are that both level switches are failed at the same time. Since we are assuming that the level switches are independent, this means that the only way they fail together is by completely random chance.
Looking at our table, the probability that both level switches fail together—assuming they are independent events—in a 1oo2 arrangement is PA*PB , as we’ve said previously. Pull out your SIL calc spreadsheet a start a column for the 1oo2 case, like so:
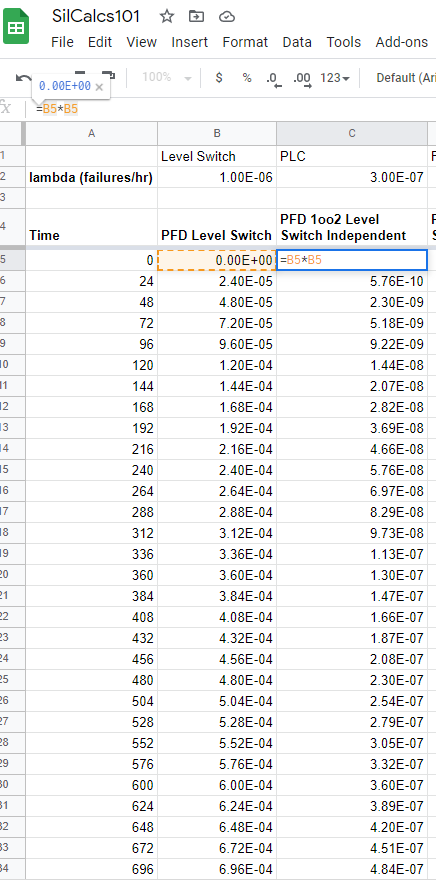
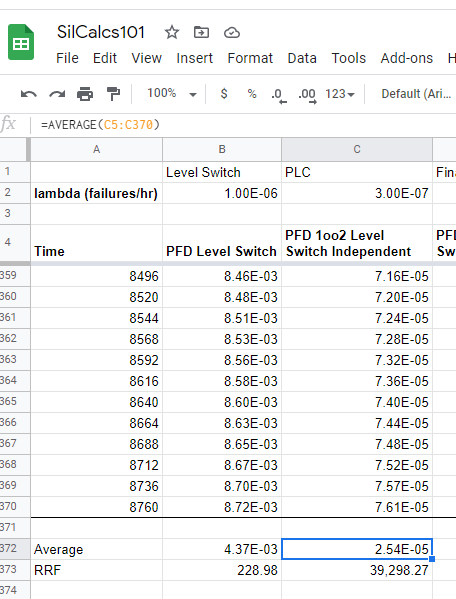
We are assuming that our two level switches are identical, i.e. have the same lambda, so there is really no need to model the second switch. You can model the second one if you like, but the numbers for probability of failure on demand will just be identical to what you got for the first switch. As you can see, I have just taken the PFD for the first switch and squared it to get the PFD for the 1oo2 system. Once that’s done, take the average and RRF for the 1oo2 system, as shown below:
It is quite important to note that we applied the logical operation—e.g. multiplying PA*PB (I am calling it a “logical operation” because technically it is the intersection of two sets in the Venn Diagram)—at each point in time. Alternatively, we could have tried taking the average of PFD first, and then applying the logical operation, but we would find that this produces a large error! This is known as doing “logic before mean” and it is an important topic, though one for another day.
2oo2 Independent Level Switches Permalink
The 2oo2 arrangement means that if either level switch fails, then the safety function fails. Referencing our chart, we see that we are looking for PA + PB – PAPB. Add a 2oo2 column to your sheet, and enter the required calculation, like so:
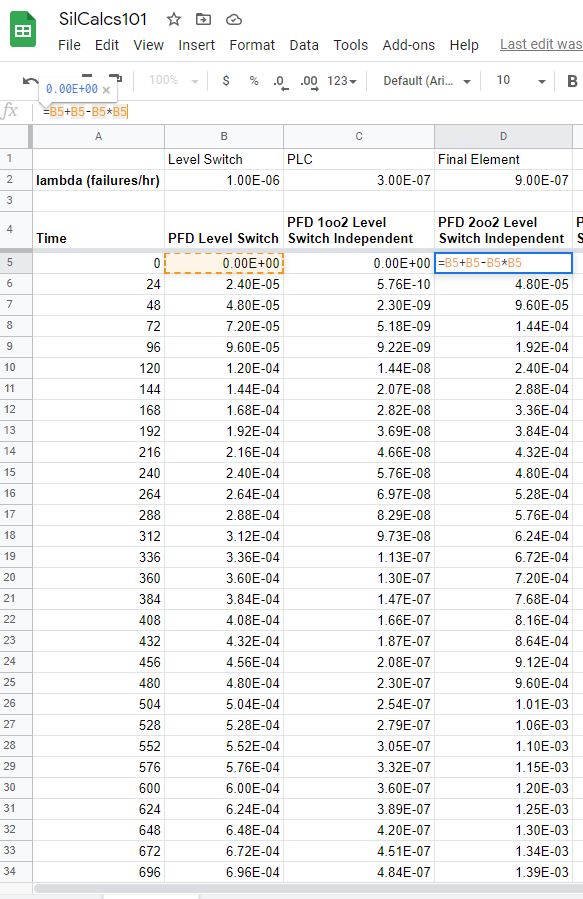
Again, since we assume that the level switches are identical, there is no need to model any new devices. Compute the PFD for the entire year, and then find the average and the risk reduction factor:
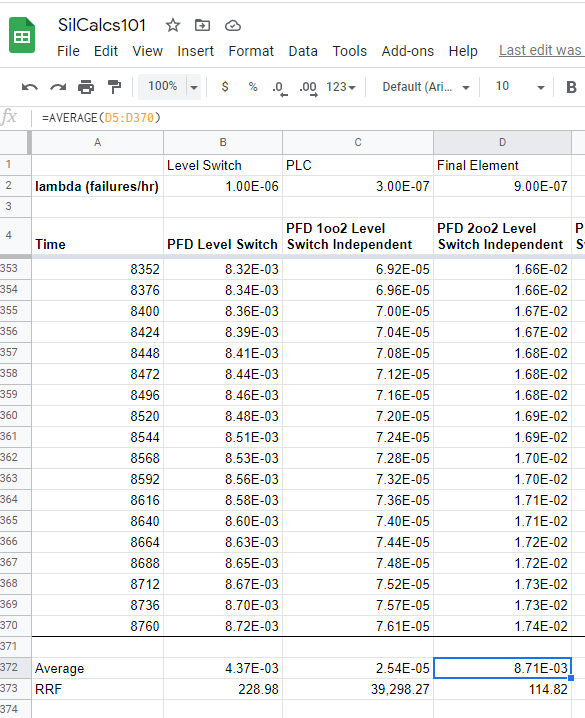
Getting the hang of it yet? I told you it was wonderful fun, try it out on date night sometime. I don’t think we need a step by step tutorial for the remaining cases in the table. I will post screenshots of my spreadsheet at the end of this post so that you can reference my formula bar if you need it. There is nothing tricky about the remaining cases, just watch out for typos in your sheet.
Modeling a Full SIF Permalink
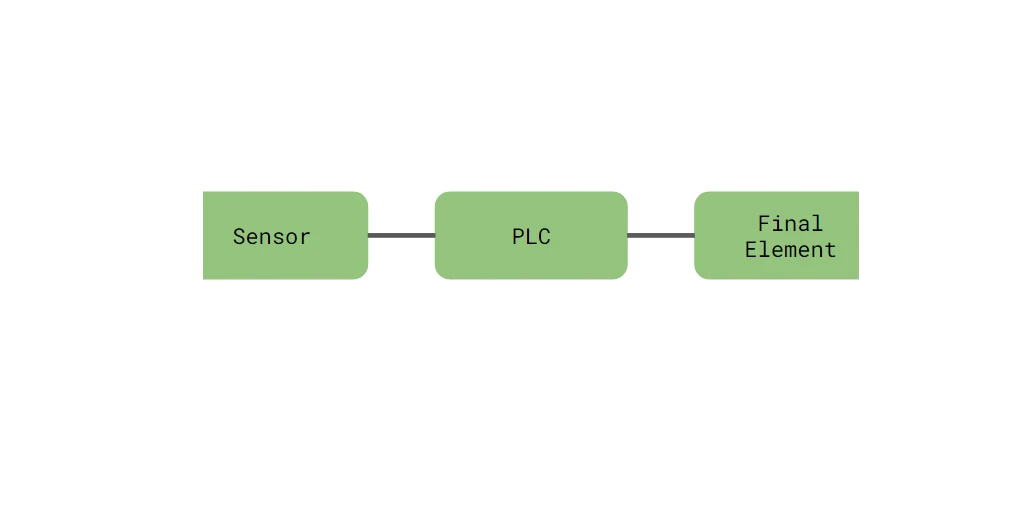
Believe it or not, you can now model an entire SIF, end to end, even though we have only discussed how to model sensing elements so far. Take a look at the diagram of the safety function below:
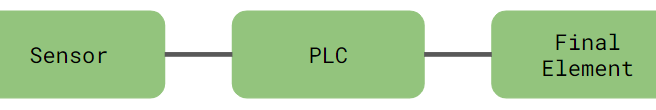
They key insight here is that the sensor, logic solver, and final element are in a voting arrangement. To see which arrangement, ask yourself how many of the components can fail before the safety instrumented function fails? Well, if any one of the above fails, the SIF won’t work. Since there are 3 components total, and we need all 3 of them to work, then this is 3oo3 voting.
Now that we understand the voting, the modeling process just proceeds as before. We will need failure rate data for the PLC and for the final element. Lets head on over to SILSafeData and get some numbers. For the PLC, I am going to use the high bound dangerous undetected fail rate for the main processor on a safety PLC, shown below. We are only going to model the main processor in this example, to keep things simple.

Recall that the units here are FITs, or failures per billion hours. Converting this to failures per hour:
Next we need a lambda for our final element. Let’s say it’s a trunnion ball valve which closes when the SIF trips:

Again, we are only going to model the valve body for this example. Normally you would need to model the valve body, the actuator, solenoids, etc.
Converting our 900 FITs to hours:
Great, we’ve gotten all of our lambdas, now we model each element as a 1oo1 (single element) system. After that, we deal with combining them. Start with the PLC, enter the lambda into the spreadsheet and then use the basic equation to model the failure rate:
See the screenshot below of my spreadsheet with the lambda entered and the formula for modeling probability of failure on demand for the PLC.
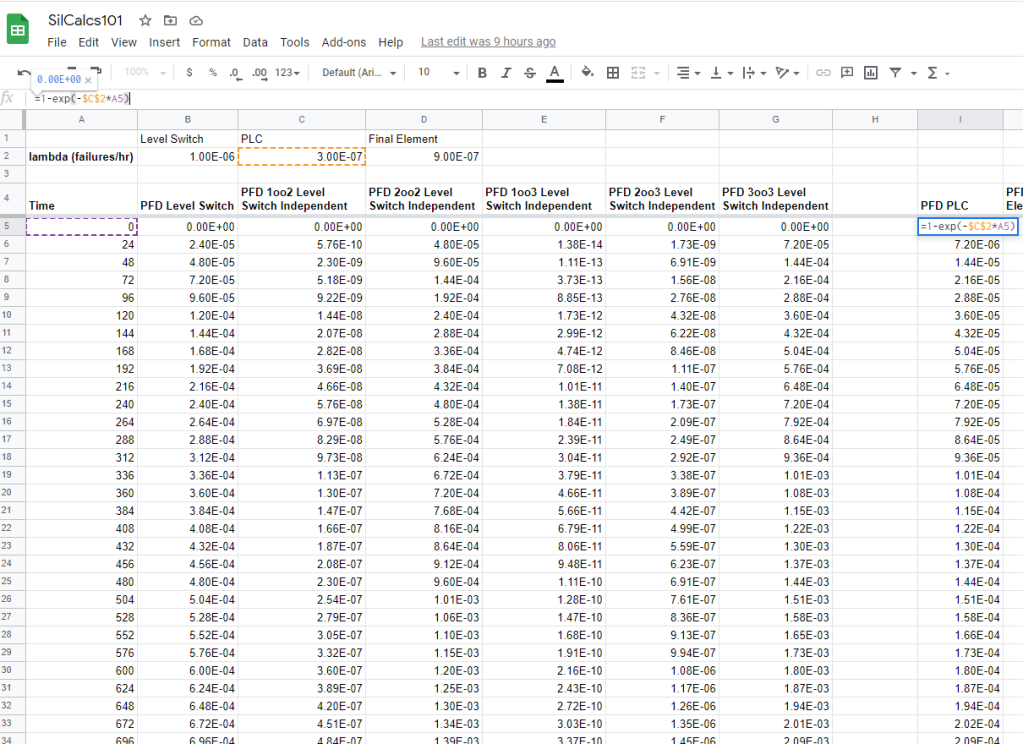
As usual, mind the dollar signs in my formula bar around the value of lambda. Take the PFD average and RRF once you’re done, like so:
Do the same operation for the valve, should look like this when you are done:
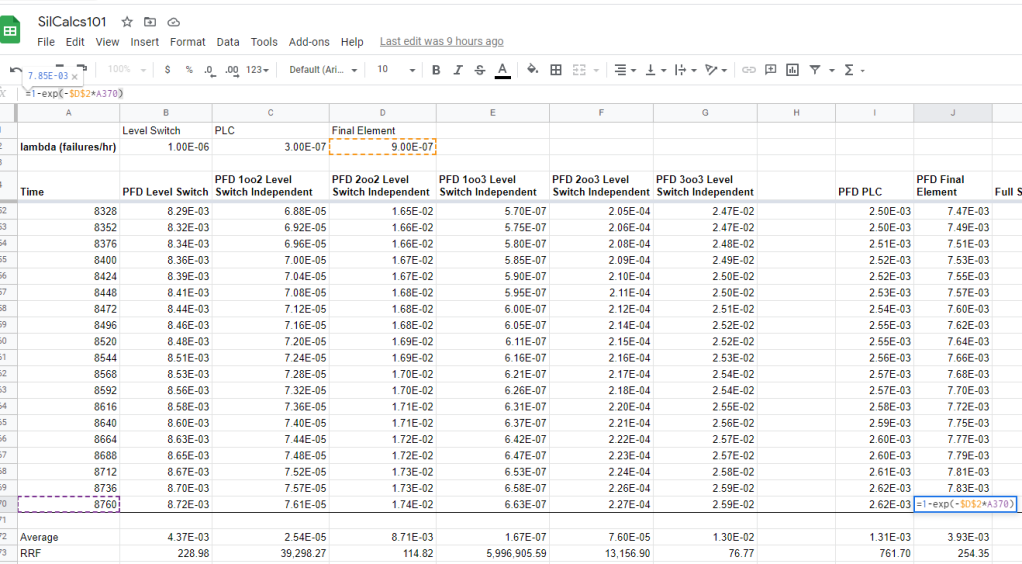
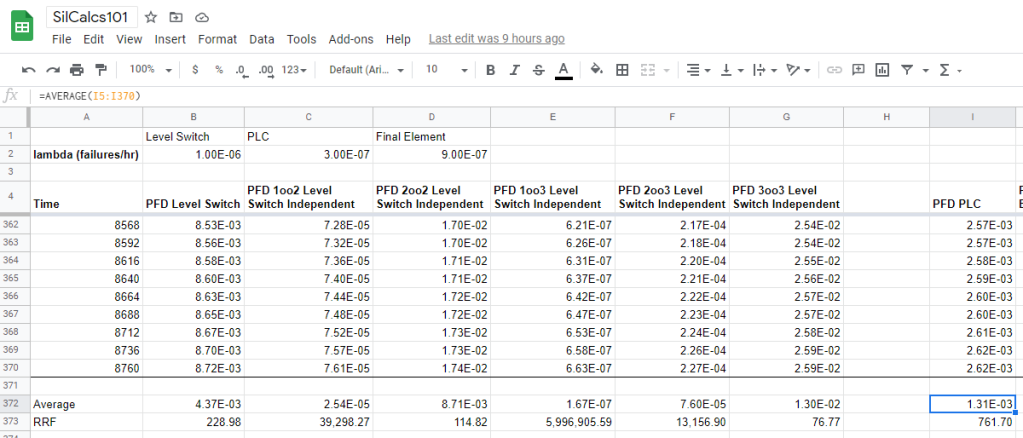
All that remains is to combine our three single element systems (level switch, PLC, valve) into a 3oo3 voting arrangement—which we proved earlier modeled the full SIF. Checking the table at the start of this post, we see that the required formula is: PA + PB + PC – PAPB – PAPC – PBPC + PAPBPC
Go slow when entering the formula, it’s not too bad:
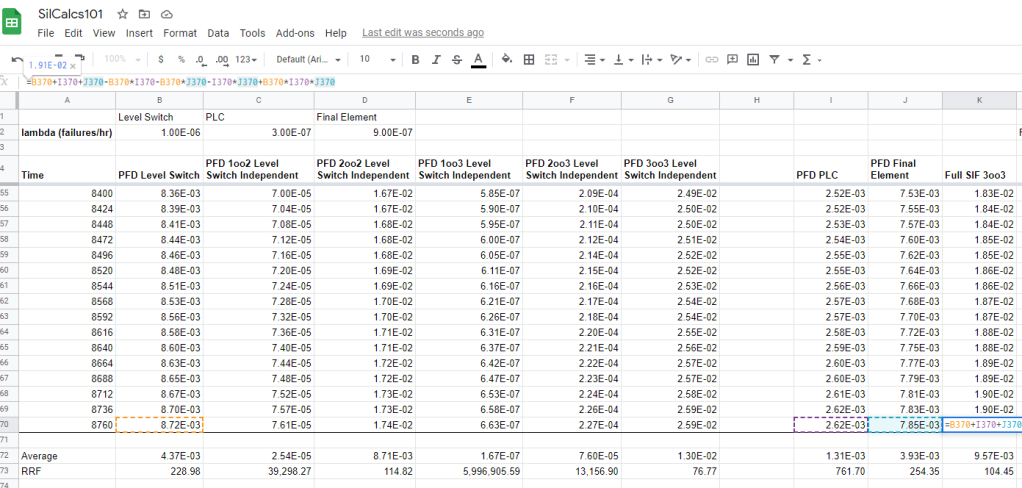
We’ve just modeled an entire SIF end to end! Granted it was a bit simplified, but still.
Once you understand this simplified SIF, extensions are straightforward, if a bit tedious. For example, what if you had this same PLC and final element setup, but instead of a single level switch you had a 2oo3 level switch arrangement? Well, first model the 2oo3 level switches as we have previously discussed, then take the PFD for the 2oo3 system and feed that into the 3oo3 model for the full SIF. We could continue on, ramping up the complexity of the system, but once you see the pattern, this kind of thing is better left to official SIL calc software.
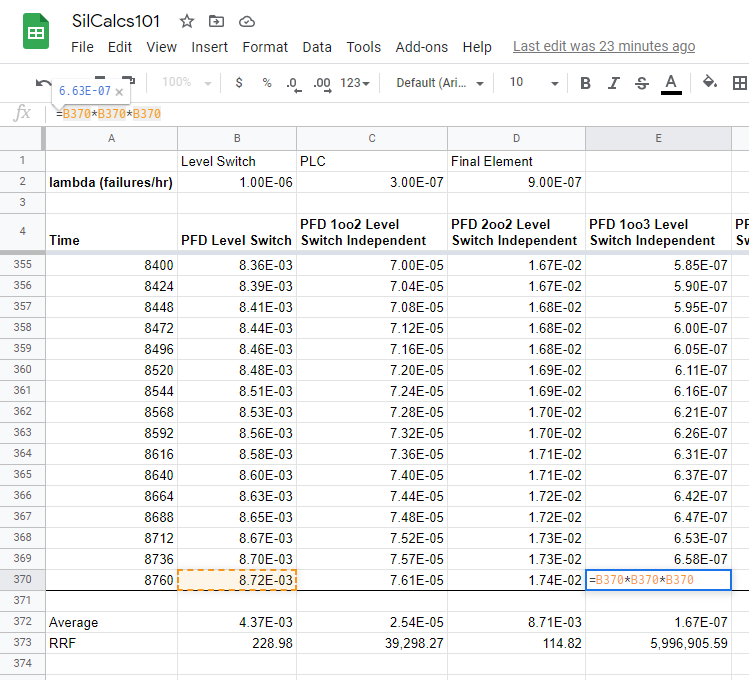
1oo3 SIF Model Permalink
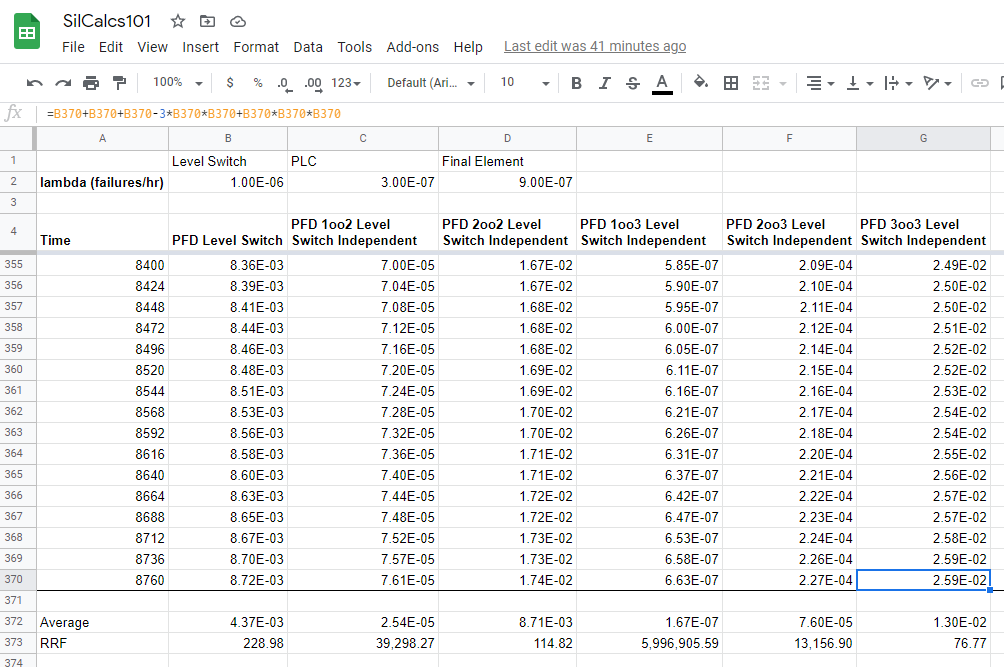
As promised, here is my SIL calc spreadsheet for the remaining cases, starting with 1oo3. I am assuming you have a handle on the average and RRF by now, so I won’t be showing that formula explicitly.
Recall from our table that the 1oo3 case is: PAPBPC
Ah ha! We can make our lives easy here because all three of the level switches in our three element system are identical. So the probability of failure on demand for each level switch—at some time t—is the same. Excellent, this means that:
You’ll notice in the spreadsheet that I just take the PFD for the level switch and cube it:
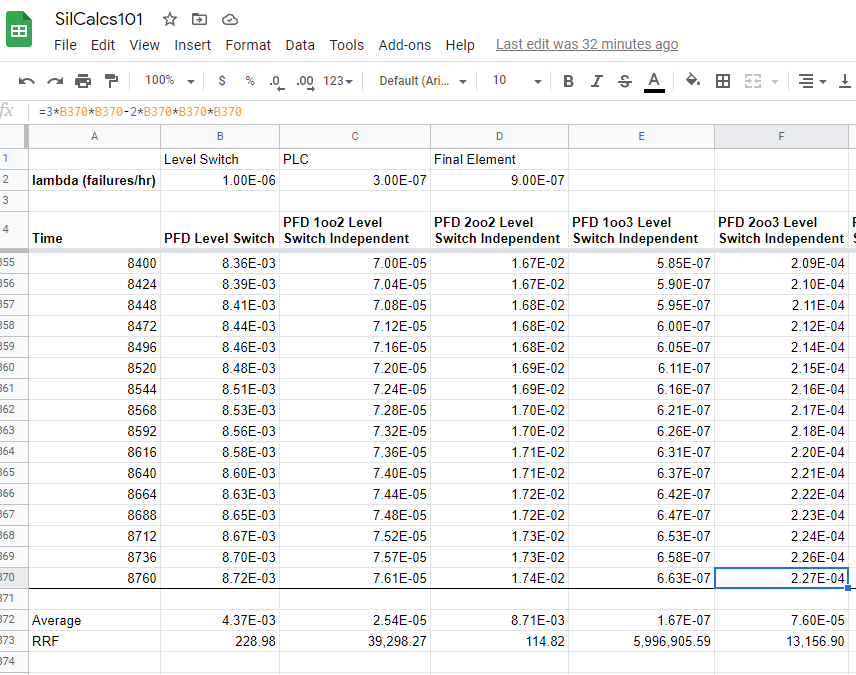
2oo3 SIF Model Permalink
Again we are going to simplify the equation based on the assumption that the probabilities for all three devices are identical. This is really just to cut down on the chances we make a typo, you can always just enter the raw formula if you like. Based on the table above we know that the 2oo3 formula is:
Since all the probabilities are the same, we get:
3oo3 SIF Model Permalink
Let’s finish up with the 3oo3 system. The table tells us the formula is PA + PB + PC – PAPB – PAPC – PBPC + PAPBPC. Assuming all the level switches are identical we get:
As you can see sometimes I don’t bother simplifying the formulas all the way in the spreadsheet.
SIL Voting Arrangement Visual Permalink
The next topic to cover is proof testing, and how to model it. Before we head off in that direction though, I thought it would be nice to give you a visual of the different SIL voting arrangements we just modeled. Check out the graph below, I have plotted all of the voting arrangements discussed in this post. I think I used a lambda of 1 or something similarly unrealistic, just to help with visibility.
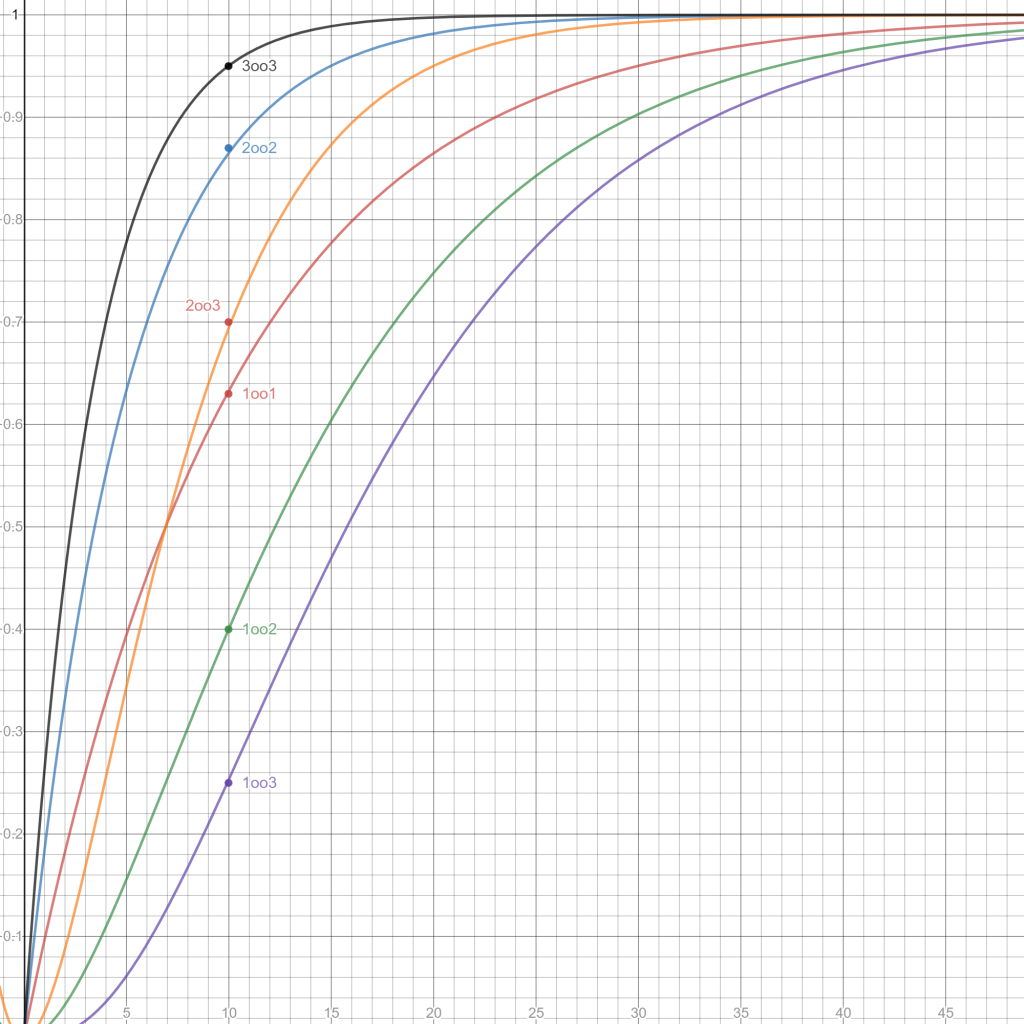
The y-axis here is probability of failure on demand, and the x-axis is time. Most of the voting arrangements follow predictable patterns, the chances of a 1oo3 system failing are less than a 1oo2 system. What’s interesting here is the behavior of the 2oo3 system, which is often used as a compromise since it has lower PFD than 2oo2 or 3oo3 systems, provides redundancy unlike a 1oo1 system, and has a better spurious trip rate than 1oo2 or 1oo3 systems.
Congrats on making it this far. Next up we talk about proof testing.