SIL Calcs 101: Beta Factor Intro
Beta Factor Introuction.
It is time, time for the final complication—well, of the introductory series anyway. Beta factors give us the ability to model dependent events, and that is the piece we need to complete our model.
How Beta Factors Work
First thing is first, what does beta actually do? The basic idea is that we take the failure rate (lambda) for our equipment, and we split it into two pieces. Let’s take our level switch as an example, it has a lambda of 1e-6 failures/hour (high bound dangerous failure rate pulled from SILSafeData). Beta splits this failure rate into two pieces—a dependent piece and an independent piece—which must sum to the original failure rate:
Here λI is the independent portion of lambda, and λCC is the dependent portion—we use “CC” (for common cause) instead of “D” as the subscript to avoid confusion (“D” could mean either “dependent” or “dangerous”).
It is critically important to see that the failure rate of the device has not changed, all we have done is partition it. The device’s failure rate is taken as an empirically determined fact, and is a constant. Stated another way, what we have done is acknowledge that our device’s failure rate contains a mix of common cause failures and of independent failures, and have just split them out.
Enough dawdling, we still haven’t mentioned how beta enters into this picture. It is actually quite straightforward: beta describes the size of the common cause partition, like so:
As you can see above, (1-β) represents the independent fraction of the failures, and β represents the dependent fraction of the failures. This will all become clear with use, but first, some intuition.
A Simple Example
Forget about lambdas and betas for a moment. Assume we have two level switches, and that each one fails ten times per year. Also, lets say that the level switches are disjoint, i.e. it is physically impossible for them to fail at the same time—if you need a refresher, check out the Venn Diagrams post.
2oo2 Voting Disjoint
Now, consider how a 2oo2 arrangement of these level switches behaves. Think through it, if the switches vote 2oo2, then if either one fails our safety function no longer works. Assume that if a switch fails our safety instrument function is out of commission for a full day. How many days per year is our SIF not functional? Well, since each level switch fails ten times a year, and it’s impossible for them to fail together (by assumption), then our SIF is down twenty days a year.
1oo2 Voting Disjoint
Consider the 1oo2 arrangement of these same level switches. The switches are still disjoint, both still fail ten times a year. Let’s think through the 1oo2 configuration: I only need one of the level switches to vote to trip for the SIF to trip. That means that as long as at least one of the switches is functional, the SIF is functional. Each level switch fails ten times a year, but they never fail together. Therefore, our SIF is never down! Clearly this is an unrealistic situation, but we are trying to illustrate a point.
Next, let’s walk through the above situations again, but allow the level switches to fail together. It doesn’t matter if the simultaneous failures are due to random chance or to common causes at the moment, just focus on the fact that they can fail at the same time. For the sake of simplicity, assume that one time per year the switches fail together (i.e. on the same day). Note that each level switch still fails ten times per year, this is critically important, all we are doing is saying that once a year those failures line up. So, for each switch, nine times a year it fails on its own, and one time each year in fails in conjunction with the other switch.
2oo2 Voting Overlapping
Step through the 2oo2 voting again: in a 2oo2 structure I need both devices to work. Therefore, if either (or both) devices fail, the SIF doesn’t work. How many days a year is our SIF down? Well, each level switch fails 9 times a year on it’s own, so that’s eighteen days. Then, once per year both switches fail on the same day, which brings the total to nineteen days our SIF is down each year.
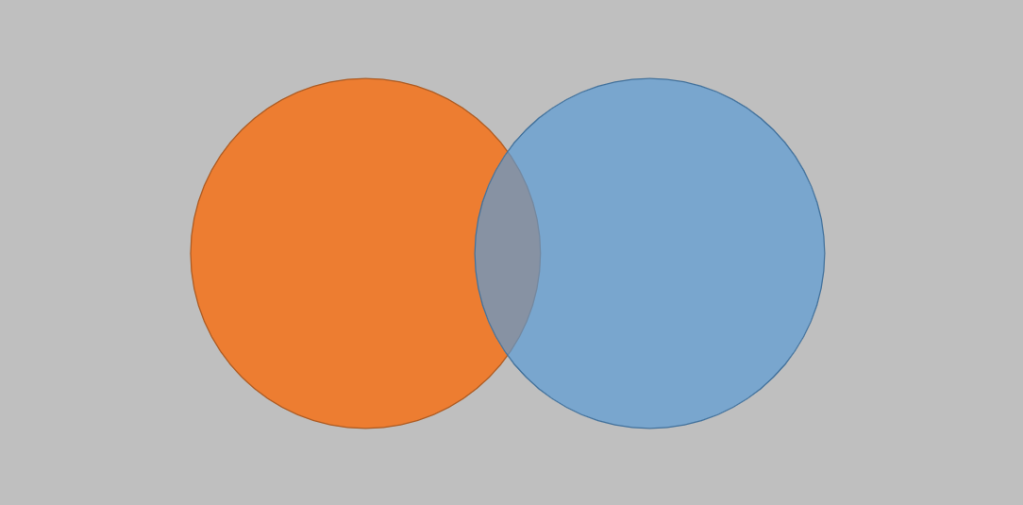
This should strike you as strange! We allowed our level switches to fail simultaneously (i.e we made the model more realistic), and all of a sudden our SIF is down less days each year (in PFD terms we would say that our PFD average has gotten better). I am here to tell you that it is not strange, or counterintuitive, or really all that mysterious. It is just the result of sliding the circles around in our Venn Diagram (I like to call this the sliding disk model because I think it sounds cool). Check out the below diagram:
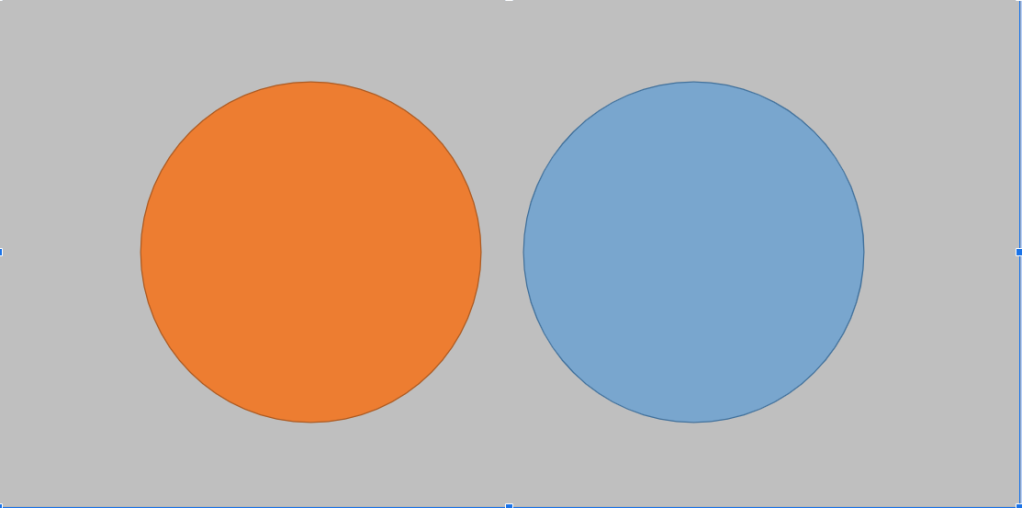
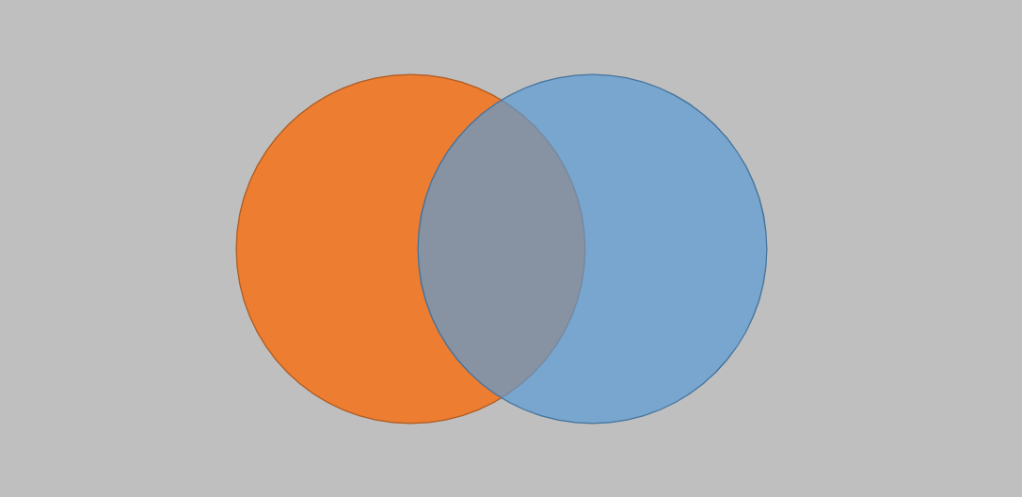
This is a model of the disjoint situation—level switches can’t physically fail at the same time. We can tell that because the circles don’t overlap (recall that the area of each circle represents how likely the device is to fail). Remember that to calculate the chance of failure for disjoint events, in a 2oo2 voting arrangement, we add the areas of the two circles—again, check the Venn diagram post if you need the details. Keeping that in mind, take a look at a Venn Diagram of events that can happen together (overlapping events):
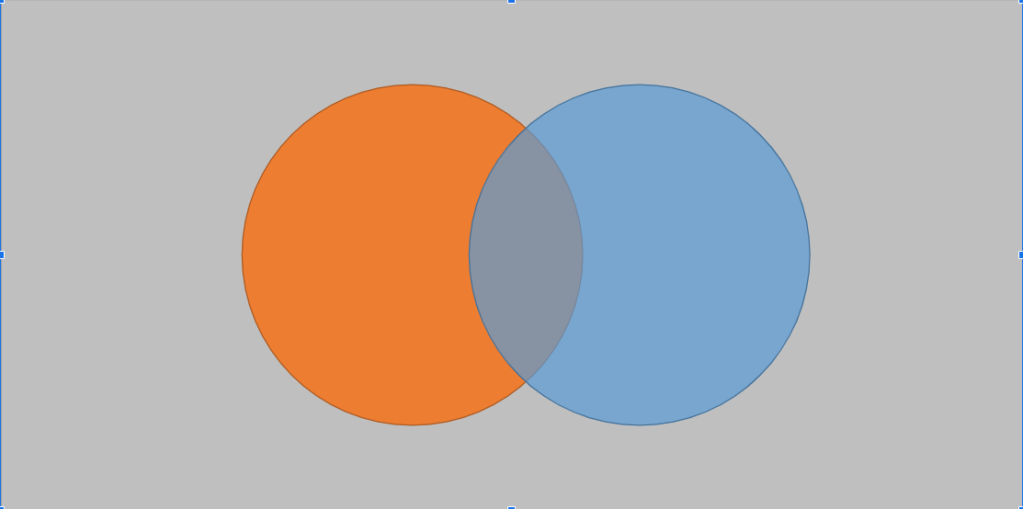
You’ll notice we have slid the disks together, creating an area of overlap. The procedure for finding the chances that an overlapping system fails, in a 2oo2 voting structure, is to add the areas of the circles, but then to subtract out the area of the intersection. This implies that the probability of failure for overlapping events, in a 2oo2 voting arrangement, will always be smaller than for the disjoint case! Why? Because we slid the circles together, and so the total space they occupy on the Venn Diagram is less. Mathematically we would state that:
1oo2 Voting Overlapping
Finally, let’s revisit the 1oo2 voting arrangement while allowing the switches to fail together. A 1oo2 system implies that I only need one of the switches to vote to trip my safety function, so as long as I have one good switch I am okay. How many days a year am I down? Well, we just said both switches need to fail for the system to fail, and—per our assumptions—the switches only fail together 1 day per year. So, that means my safety function is only down one day per year.
Recall that, in the disjoint 1oo2 voting case, it was impossible for my safety function to ever fail. Once we allowed the switches to fail simultaneously (whether by chance or by common cause), we jumped from never to once per year!
Summing it up
To summarize, when we slide the disks together—which translates to allowing our devices to fail together—the PFD (probability of failure on demand) for voting structures involving unions (i.e 2oo2, 3oo3, MooM) goes down, because the total area is less. Voting structures involving intersections (1oo2, 1oo3, 1ooM) see their PFD go up, because the area of the intersection is increasing.
The Sliding Disk Model
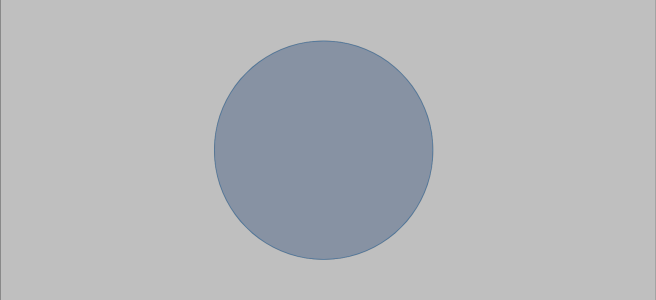
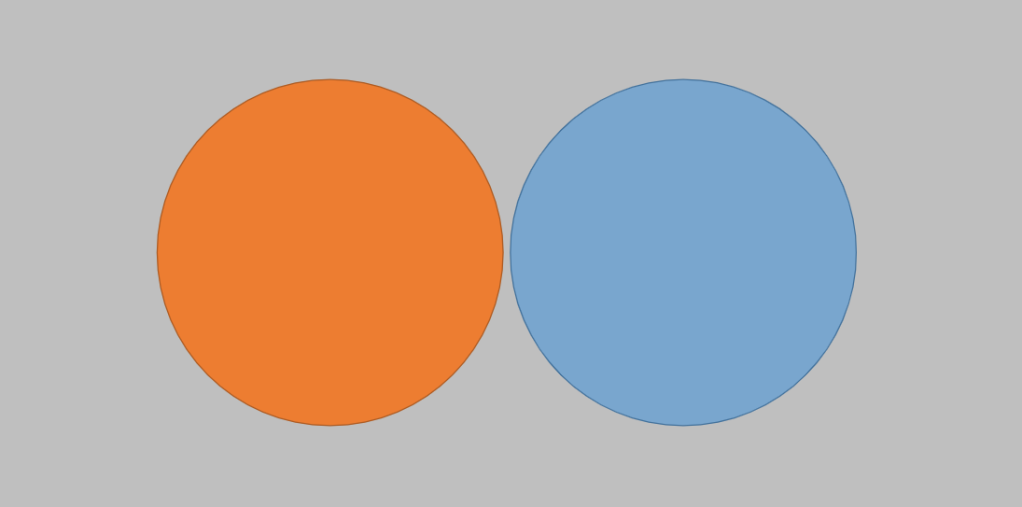
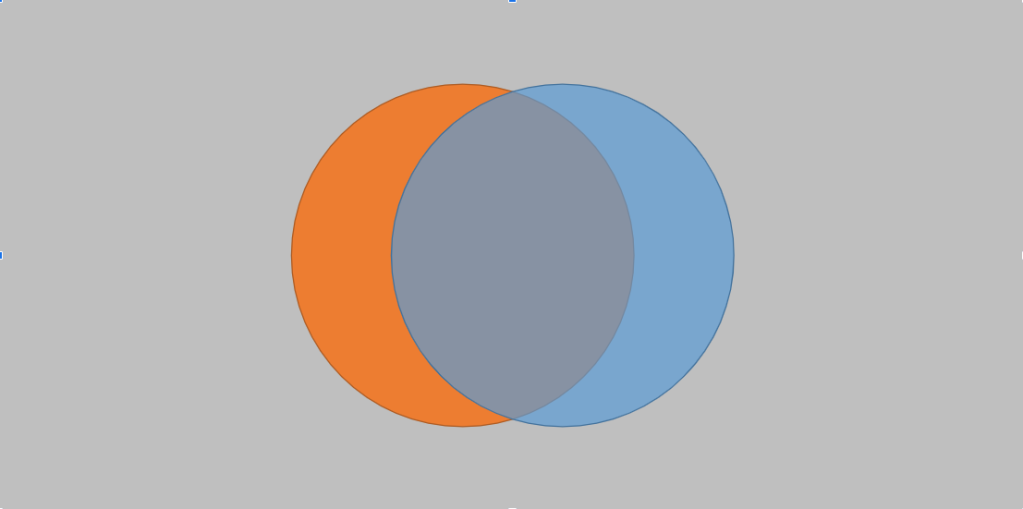
Picture, in your mind’s eye, the two disks slowly coming together. The more that they overlap, the less total area they occupy on the Venn Diagram. This implies that the chances of the 2oo2 voting system failing are decreasing. Additionally, the more they come together, the larger the area of their intersection. This implies that the chances of the 1oo2 system failing are increasing. In the extreme case, where the events are perfectly correlated, the circles would overlap entirely. The series of stills below should help:
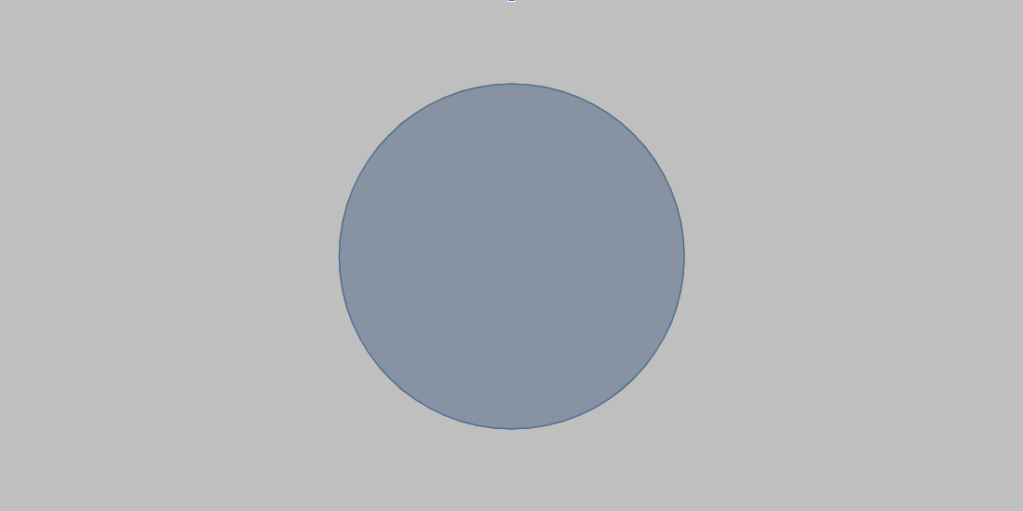
Perfectly Correlated Events
In the above diagram, the area of the two disks is minimized, and thus the chances that the 2oo2 system fails are minimized. The area of the intersection is maximized, and so the chances of the 1oo2 system failing are maximized. In fact, in this case, the PFD for the 2oo2 and the 1oo2 system are identical!
Think through it with me, each level switch fails ten times per year. In the case of perfectly correlated events (the disks overlap entirely in the Venn Diagram), the level switches always fail together. Examine the 2oo2 voting structure; I need both switches to work for the safety function to work. This implies that if either, or both, switches fail, the safety function fails. Since the switches always fail together, ten times per year, we can conclude that in the 2oo2 case our system is down ten days per year. In the 1oo2 arrangement we need both level switches to fail for our safety function to fail. Since we know that the switches fail simultaneously ten times per year, we conclude that the system is down ten days a year, same as the 2oo2 case!
Big Picture
Familiarizing yourself with the above examples will prove extremely helpful when it comes to practical applications. You will often hear people say things like “Don’t model beta in that 2oo2 SIF, but make sure you add beta to that 1oo2 SIF”. After reading through this post a couple of times, you should be able to understand why.
Modeling beta for a 2oo2 arrangement (or any MooM structure), causes the calculated PFD average to decrease, and so it’s typically not done in practice. It is important to understand that just because it is not done, does not mean that something is wrong with our model or our reasoning. We are not implying that our model does not accurately represent reality, we simply don’t model it this way in practice because it’s not conservative.
Conversely, we almost always model common cause failure with NooM arrangements in practice. This is because a) it represents reality, and b) it is conservative to do so, since modeling common cause increases the PFD average for such voting schemes.
Important Technicality
All Or Nothing
We need to point out a technicality of the beta factor model:
*Beta tells you the chances that all the devices fail together, and 1-β tells you the chances that a single device fails.*
Read that very carefully while thinking about a complex system, say something with three devices. Notice that nowhere do we mention what the chances of any two devices failing together are, this is because beta does not model this!
The beta factor model is, by design, all or nothing. It partitions lambda into two pieces, one representing the failure rate of any single device, and one representing the failure rate of all devices due to common causes.
It’s important to remember that our models are not always perfect. Logically, we might expect that any common cause capable of failing all of our devices would have some bearing on the failure rates of say, two of our devices. Beta, however, simply does not account for this.
Next time we get to the good stuff, practical application of beta in our spreadsheet. See you then.