Partial Stroke Testing
Partial Stroke Testing Overview
When we partial stroke test a valve, we move it a little bit (<10%), then put it back to it’s original position. The idea is to prove that the valve is functional, without interrupting the process. However, we need to figure out how to adjust our proof test coverage to account for the partial stroke test.
Your first question might be, why do we have to adjust the proof test coverage when we partial stroke test? Well, the partial stroke test is assumed to uncover failures that would have ultimately been found by the proof test. For example, if I partial stroke test the valve and it passes, then the valve stem isn’t sheared (it did just move 10% after all). Our proof test would have also found this particular failure (broken stem), so we need to be careful not to take credit for finding it twice (i.e if the partial stroke test determines that the valve stem is functional, then I don’t also get to determine that the valve stem is functional based on the proof test, that would be double counting).
In fact, our working assumption here is that every failure that the partial stroke test is capable of finding, would have also been detected by our proof test. That is to say, the set of failures detectable by the partial stroke test is completely contained within the set of failures detectable by the proof test.
Other assumptions are possible—you could argue that your partial stroke test finds some particular failure that is not detectable by your proof test—but I think that is a tough argument to make (why would stroking a valve 10% uncover a failure that stroking it 100% doesn’t?). Anyways, assuming that the sets of detected failures are completely overlapping is the most conservative option, so we will use it here.
Partial Stroke Tests Calcs
Once you understand the assumptions, it’s pretty straightforward. If my partial stroke test (PST) has a coverage of 50% (so it finds 50% of the total failures), and my computed overall proof test coverage (PTC) is 81%, then, my adjusted proof test coverage is 31%. That is to say, if my PST finds 50% of the failures, then my proof test finds the remaining 31%, since I know that the overall proof test coverage must be 81%.
You will most often see this adjusted PTC expressed as a percentage of the remaining failures, instead of as a percentage of that total failures (which is what I have done above). This isn’t difficult to do:
If my proof test finds 50% of the failures, then 100%-50% = 50% of the failures remain.
If my adjusted PTC is 31% of the total failures, then, as a percentage of the remaining failures: 31%/50% = 62%. I.e. my proof test finds 62% of the failures which remain after doing a PST.
Extended Calcs
Sometimes you want to apply different partial stroke test coverages to different components of an assembly. Lets say we have a valve and actuator assembly, a digital positioner (which handles the partial stroke test), and a solenoid (which handles the SIS trip function). You reason that, since the solenoid stays in position during the PST, you probably shouldn’t apply any coverage to it. So, you want to apply 50% PST coverage to the valve body, actuator, and digital positioner, and 0% coverage to your solenoid.
The basic idea here is the same as above, but at this point it’s probably easier to just use a spreadsheet:
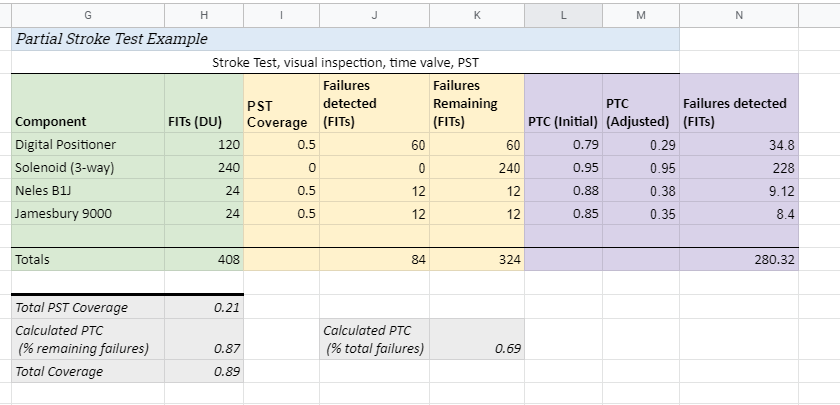
Note that I pulled failure rate data for the solenoid off SILSafeData, and I assumed a proof test coverage of 95% for the solenoid (solenoids tend to have high PTC).
Lets step through this. First, we list the FITs for each device (column H), nothing new here.
Next, we list the partial stroke test coverage for each device (column I).
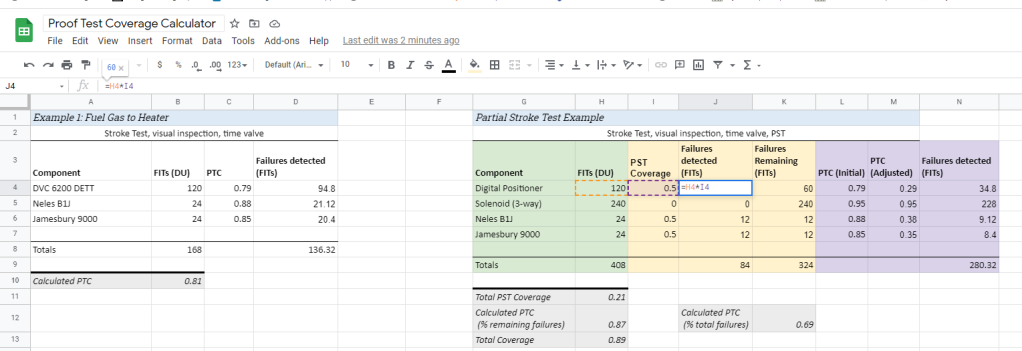
Then, compute the failures detected by the partial stroke test on each device. You just multiply the FITs by the PST coverage, like so:
Now, compute the remaining failures for each device after the PST. This is just the total failures minus the failures that the PST found:

In column L, list the overall proof test coverages for each device (same as when we were doing it in the simple example above).
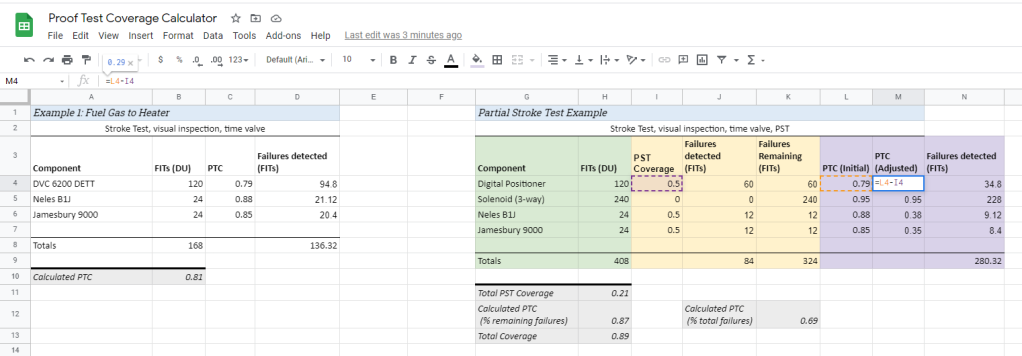
In Column M, compute the adjusted proof test coverage for each device (as a percentage of the total failures). This is just the initial PTC minus the partial stroke test coverage.
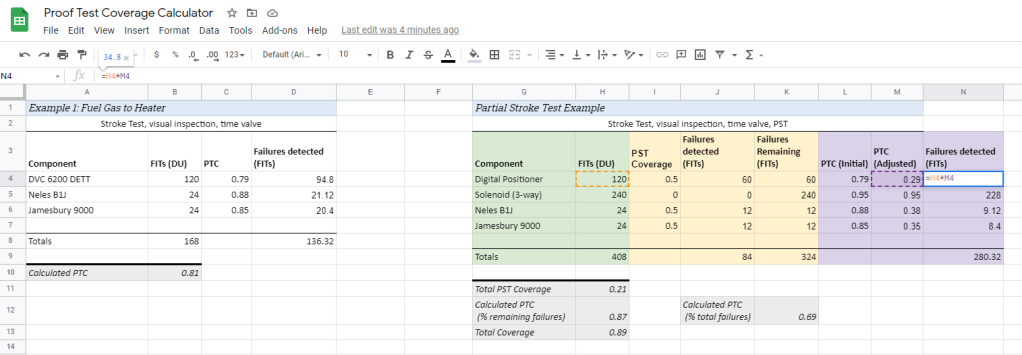
Then compute the failures detected by each proof test. This is the adjusted PTC*total FITs:
Total partial stroke test coverage is simply the failures detected by the PST divided by the total failures:

Proof test coverage, as percentage of failures remaining after partial stroke testing, is just the failures detected by the proof test divided by the failures remaining:
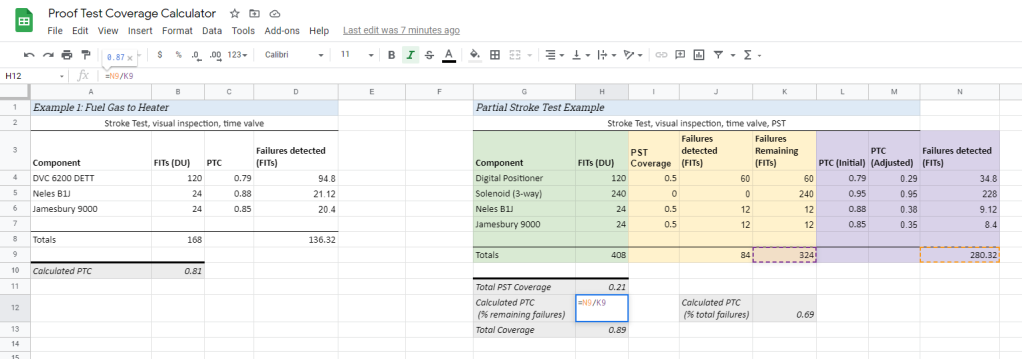
Overall coverage (PST and proof test) is just the total failures detected divided by the total failures:
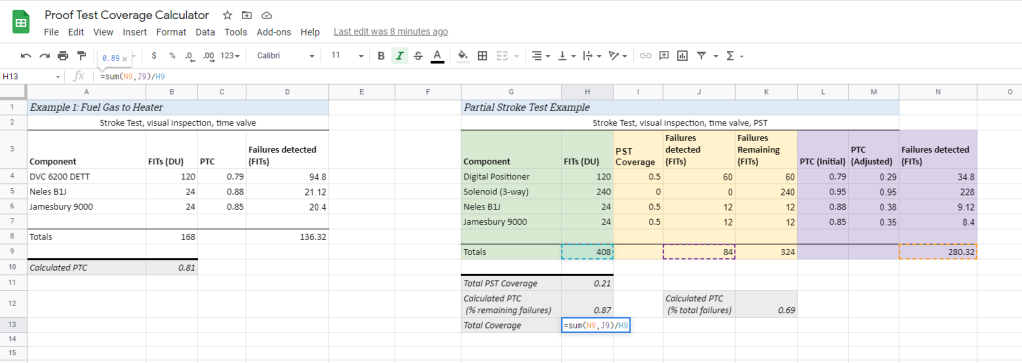
Finally, the PTC as a fraction of the total failures (as opposed to as a fraction of the remaining failures) is failures detected divided by total failures:

Nothing to it.
Partial Stroke Test Coverage
Final topic, how do we actually assign partial stroke test coverages? Well, this one is also tough. Sometimes vendor or generic data has numbers you can use. You might also have internal data that you can use. If you don’t have any of that, you can try the ISA technical report on partial stroke testing, which makes an attempt to come up with some very loose numbers. They make a big point of saying this is general data, not backed by any statistic analysis, based mostly on expert opinion, so be cautious with it.
I can’t copy the data here, since they want you to buy the report, but basically they define four different levels of partial stroke testing, stratified based on the rigor and instrumentation involved in the test.
Next Time
Next up, we will discuss the derivation of our basic equation, and then I am thinking about walking through how we derive the simplified equations.